What Is Power Query? Replace VLOOKUP in Excel
Quick Decision Table
| Situation | Recommended tool |
|---|---|
| One-time cleanup of 200 rows | Excel formulas / manual |
| Cross-referencing two tables with VLOOKUP | Power Query Merge |
| Same cleanup repeated every week or month | Power Query (automates it) |
| Data in “months as columns” format | Power Query Unpivot |
| Combining 12 monthly files into one | Power Query Append from folder |
| Calculations and metrics on already-clean data | DAX (not Power Query) |
What Is Power Query?
Power Query is the visual ETL (Extract, Transform, Load) tool built into Excel and Power BI. It connects to a data source, transforms whatever arrives — without code, step by step, repeatably — and loads the result ready to analyze. Set it up once; next time just hit Refresh.
What specific problem does it solve?
The cycle you know by heart:
- You receive an Excel file every month
- It has poorly named columns, empty rows, inconsistent formats
- You spend 2 hours cleaning it manually
- Next month, you do it all over again
Power Query records those steps and replays them automatically. From the second month onward, cleaning time drops to zero.
Where Power Query lives in each version
| Application | Version | How to access |
|---|---|---|
| Excel 365 | Built-in | Data → Get Data |
| Excel 2021 | Built-in | Data → Get Data |
| Excel 2019 | Built-in | Data → Get Data |
| Excel 2016 | Built-in | Data → Get & Transform → New Query |
| Excel 2013 | Add-in | Download and install separately |
| Excel 2010 | Add-in | Download and install separately |
| Excel Mac | Limited | Data → Get Data (fewer connectors) |
| Power BI Desktop | Built-in | Home → Transform Data |
Note on Excel Mac: Power Query exists but has fewer connectors. For serious data work on Mac, consider Power BI Desktop (free, Windows only) or a Windows VM.
Power Query vs VLOOKUP: Which One to Use?
Direct rule: if you’ll repeat the table join more than once, use Power Query. If it’s a one-off lookup and the tables won’t change, VLOOKUP is fine.
The comparison that matters
| Criteria | VLOOKUP | Power Query Merge |
|---|---|---|
| Add a column to the lookup table | Breaks | Doesn’t break |
| Large data (100k+ rows) | Slow | Fast |
| Repeat the process next week | Copy formula again | Hit Refresh |
| See exactly what’s happening | No | Yes (Applied Steps) |
| User without Power Query installed | Works | Doesn’t work |
=VLOOKUP(A2, Products!$A$2:$B$100, 2, FALSE)This formula breaks the moment you insert a column in the Products table. Power Query’s Merge doesn’t — it references columns by name, not position.
When to stick with VLOOKUP
- One-off lookups you won’t repeat
- Small sheets that won’t grow
- Users on Excel 2010/2013 without the add-in installed
Your First Query in 5 Minutes
You have a messy sales CSV. Here’s how to clean it:
Step 1: Connect
- Data → Get Data → From File → From Text/CSV
- Select the file → a preview opens
Step 2: Transform in the Editor
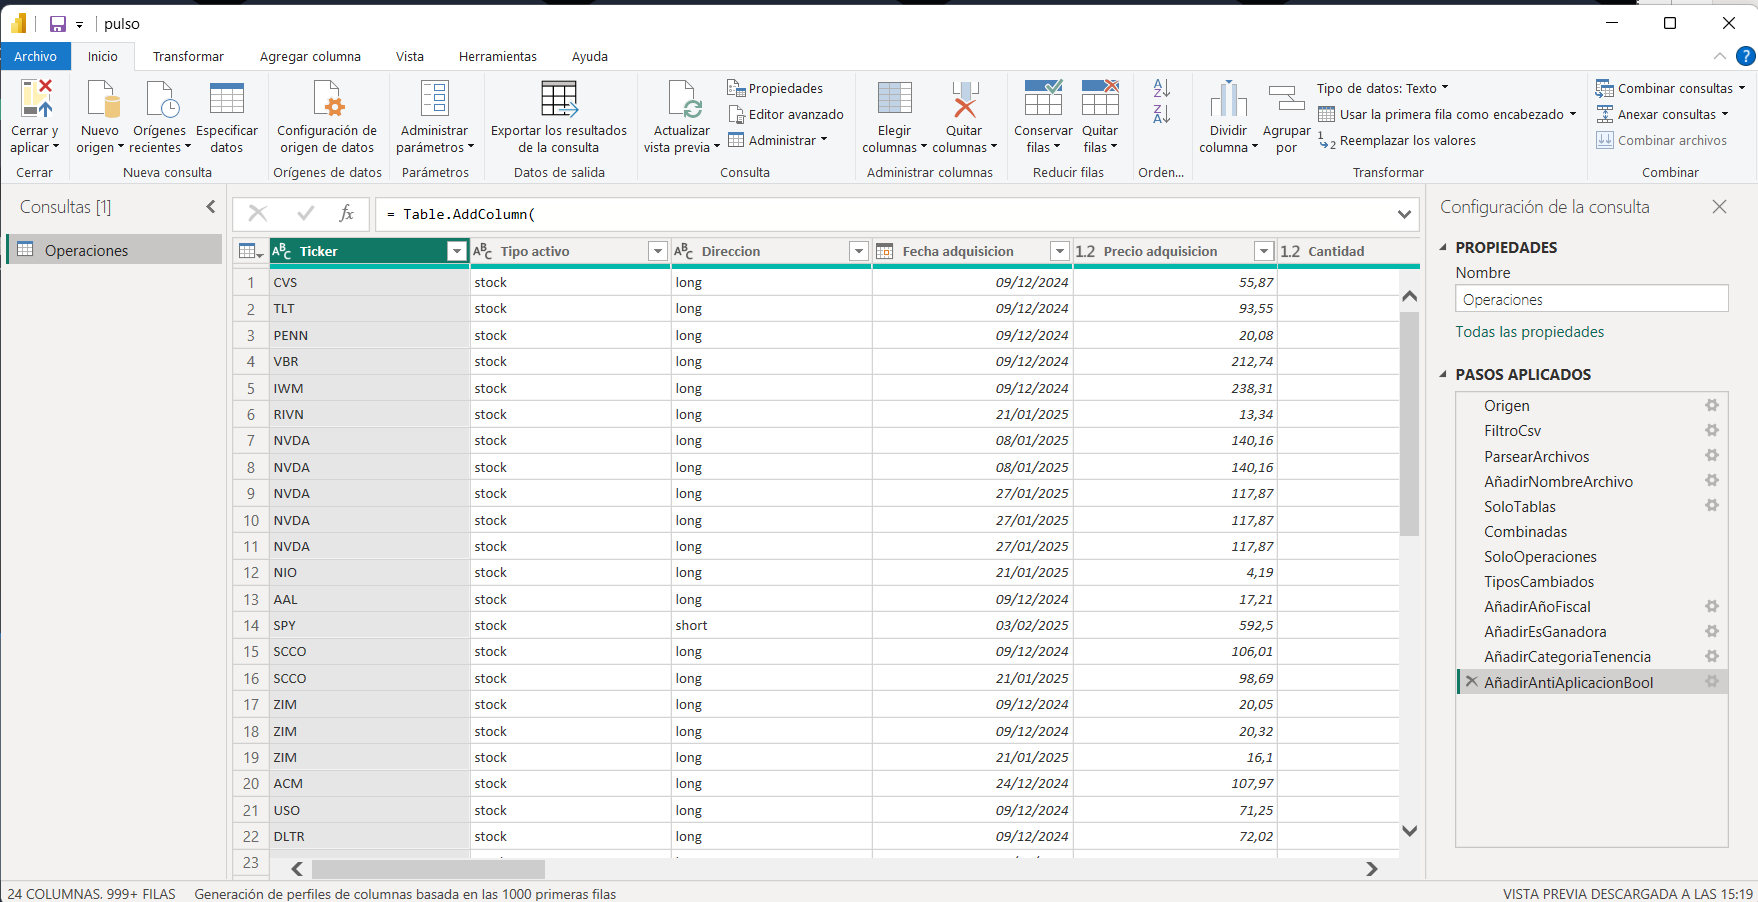
Click Transform Data. The Power Query Editor opens.
Apply these transformations:
- Remove top rows (the empty ones)
- Use first row as headers
- Change type on the Date column to date
- Trim spaces from column names
Step 3: Applied Steps — the feature that sets Power Query apart
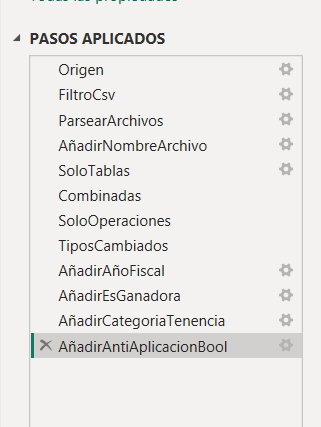
On the right you see “Applied Steps”. Each transformation is a named step:
Source
Navigation
Promoted Headers
Changed Type
Trimmed Text
Click any step to see the exact data state at that point. Delete, reorder, or insert steps as needed. This is real-time data lineage — something Excel formulas simply don’t have.
Documentation tip: rename steps with descriptive names (right-click → Rename). Three months from now you’ll know exactly why each step is there.
Step 4: Load
Home → Close & Load → choose destination (table in sheet, connection only, data model).
Done. Next time the file arrives: change the source path or just hit Refresh.
The 10 Most Useful Transformations
These cover 90% of what you’ll do:
1. Remove Duplicates
Problem: repeated rows.
Select the columns that define uniqueness → right-click → Remove Duplicates. Or from the ribbon: Home → Remove Rows → Remove Duplicates.
2. Filter Rows
Problem: you only want certain records.
Click the dropdown arrow on the column header → uncheck values or use number/text/date filters. Like an Excel filter, but it stays saved in the steps.
3. Change Data Types
Problem: the “Price” column is stored as text.
Click the type icon (ABC, 123, calendar) next to the column name → select the correct type.
Important: always review types. A postal code column like “08001” becomes the number 8001 if you don’t force it to text.
4. Split Columns
Problem: “Full Name” in a single column.
Select the column → Transform → Split Column → By Delimiter → choose the delimiter (space, comma, etc.).
5. Merge Columns (Concatenate)
Problem: “First Name” and “Last Name” are separate and you want to combine them.
Select both columns (Ctrl+click) → right-click → Merge Columns → choose separator.
Or with a custom column in M:
[FirstName] & " " & [LastName]6. Replace Values — and the Mapping Table Trick
Problem: the data says “Yes”, “YES”, “yes”, “Y” and you need to standardize.
Basic approach: select the column → Transform → Replace Values → repeat for each variant.
Trick for multiple replacements: when you have 10+ variants to normalize, doing Replace Values one by one is tedious and clutters the query with steps. The cleaner solution is to create a two-column table (OriginalValue | NormalizedValue) — as a manual query or an Excel table — and do a Merge against it. One step instead of ten.
7. Unpivot Columns
Problem: data in “classic Excel format” with months as columns:
| Product | January | February | March |
|---|---|---|---|
| A | 100 | 150 | 200 |
| B | 80 | 90 | 100 |
And you need tabular format for Power BI or pivot tables:
| Product | Month | Sales |
|---|---|---|
| A | January | 100 |
| A | February | 150 |
| A | March | 200 |
| B | January | 80 |
Solution: select the month columns → Transform → Unpivot Columns.
This is the single highest-impact transformation for classic Excel users. Almost all company data comes in pivoted format and Power BI needs it tabular.
8. Merge (The Powerful VLOOKUP Replacement)
Problem: sales table + products table → you want to add the product name to each sale.
Solution:
- Home → Merge Queries → Merge Queries
- Select the secondary table (Products)
- Choose the join columns (ProductID in both)
- Select join type
- Expand the columns you need
Join types:
| Type | Result |
|---|---|
| Left Outer | All rows from main table; matches from secondary (standard VLOOKUP equivalent) |
| Inner | Only rows that match in both |
| Full Outer | All rows from both tables |
| Left Anti | Rows in main that are NOT in secondary (find orphans) |
9. Append (Stack Tables Vertically)
Problem: January, February, and March sales in separate files → one unified table.
- Load all three queries
- Home → Append Queries
- Select the tables to combine
Pro tip: if the files live in a folder and always have the same structure, use the folder as your source directly. Power Query loads all files automatically — when April’s file lands, just hit Refresh.
10. Group By
Problem: individual transactions → totals by customer.
Transform → Group By → group by CustomerID → new column: TotalSales = Sum of Amount.
Like a pivot table, but the result is a flat table you can keep transforming or load into the data model.
Power Query vs Power Pivot vs DAX
Common confusion. These three work in sequence, not as alternatives.
| Tool | What for | When it enters |
|---|---|---|
| Power Query | Clean and shape data | Before loading to model |
| Power Pivot | Create table relationships | After loading |
| DAX | Calculate metrics on the model | On top of existing relationships |
Full flow:
Raw data → [Power Query] → Model → [Power Pivot] → Relationships → [DAX] → Measures → VisualDo you need all three?
- Just cleaning data for classic Excel → Power Query only
- Basic analysis with pivot tables → Power Query + pivot tables
- Serious data models or Power BI → Power Query + Power Pivot + DAX
Common Mistakes
Mistake 1: Not defining data types
Power Query tries to detect types automatically and sometimes gets it wrong. Always review types after loading.
Mistake 2: Hardcoded file paths
Source = Excel.Workbook(File.Contents("C:\Users\John\Desktop\data.xlsx"))Move the file or share it with someone and it breaks. Solution: use parameters (Home → Manage Parameters → New Parameter).
Mistake 3: Not using parameters for values that change
If you filter by year = 2024, next year you’ll have to edit the query manually. Create a CurrentYear parameter and use it in the filter.
Mistake 4: Ignoring step order
Order matters. General rule: promote headers → change types → filter and clean → transform → merge with other tables.
Mistake 5: Not documenting steps
Over time you forget why you did certain steps. Rename each step with a descriptive name (right-click → Rename) and add M comments for complex logic.
M Language: When to Touch It
Every step you take generates code in M language (Power Query Formula Language). To get started you don’t need it — the visual interface covers 95% of cases.
View the code: Power Query Editor → View → Advanced Editor.
let
    Source = Excel.Workbook(File.Contents("data.xlsx")),
    Sheet1 = Source{[Name="Sheet1"]}[Data],
    #"Promoted Headers" = Table.PromoteHeaders(Sheet1),
    #"Changed Type" = Table.TransformColumnTypes(
        #"Promoted Headers",
        {{"Date", type date}}
    )
in
    #"Changed Type"
Cases where M helps:
- Transformations not available in the UI
- Complex conditional logic
- Reusable custom functions
- Performance optimization
Simple custom column:
if [Amount] > 1000 then "Large" else "Small"Power Query in Power BI vs Excel
Same engine. Practical differences:
| Aspect | Excel | Power BI |
|---|---|---|
| Loads data to | Sheets or data model | Always to the model |
| Available connectors | Many | Even more |
| Automatic refresh | Only with macros or Power Automate | Scheduled in the service |
| Sharing the result | Send the file | Publish to Power BI Service |
What you learn in Excel transfers directly to Power BI. Start in Excel if you already have it installed.
FAQ
Is Power Query available in Excel 2016?
Yes. In Excel 2016 it’s built-in under the name “Get & Transform Data”. Go to the Data tab → New Query. No additional installation needed.
Does Power Query work on Excel for Mac?
Yes, but with limitations. The Mac version has fewer connectors and some transformations are unavailable. For serious data work on Mac, consider Power BI Desktop (free) running on Windows, or a Windows VM.
What’s the difference between Power Query and Power Pivot?
Power Query cleans and shapes data before loading it. Power Pivot creates relationships between already-loaded tables and enables DAX calculations. They’re complementary, not alternatives: Power Query first, then Power Pivot.
Does Power Query replace VBA macros?
For repetitive data transformations, yes — with advantages: more maintainable, no programming knowledge required, auditable step by step. VBA is still needed for automations outside data scope (interacting with other applications, complex UI logic, etc.).
Can Power Query connect to SQL Server or databases?
Yes. Power Query includes native connectors for SQL Server, MySQL, PostgreSQL, Oracle, Azure SQL, and many more. In the Editor: Home → Get Data → Database → select your engine.
Is Power Query the same as Power BI?
No. Power BI is a complete analytics and visualization platform. Power Query is one component of Power BI (and Excel) responsible for extracting and transforming data.
Can Power Query be used without internet?
Yes, for local sources (Excel files, CSV, folders, network databases). Cloud service connectors (SharePoint Online, Dynamics, Salesforce) require a connection.
How many rows can Power Query handle in Excel?
Power Query in Excel loads data either to a sheet table (1,048,576-row limit, Excel’s sheet maximum) or to the Power Pivot data model (no practical limit, depends on RAM). For large datasets, always load to the data model, not the sheet.
Resources for Continued Learning
Official docs:
YouTube:
- ExcelIsFun (Mike Girvin) — solid Power Query tutorials
- Leila Gharani — clear and practical
Books:
- “M is for Data Monkey” (Ken Puls, Miguel Escobar) — the reference book
Where to Start
- Find Power Query in your version of Excel (Data → Get Data)
- Load a CSV and explore the interface
- Work through the transformations in this post with real data
- Automate something you do manually every week or month
- Measure the time saved
Once Power Query clicks, the natural next step is learning DAX to calculate metrics on your already-clean data. And if after all that work nobody looks at your dashboard, at least the data will be spotless.
If the end goal is going beyond Excel and building real pipelines, the data engineering guide covers the full path.
Related course
Learn Data Engineering with real practice
Step-by-step modules, hands-on exercises and real projects. No fluff.
See course →You might also like
Power BI vs Tableau: Which is better in 2026?
Real comparison of Power BI vs Tableau: pricing, learning curve, job demand, and when to use each one.
Power Query: Document the Why, Not Just the What
Why checking the history before touching the model can save you hours of rework. A practical guide to documentation in Power BI.
VertiPaq for humans: how Power BI compresses your data
Value Encoding, Dictionary Encoding, and RLE explained without the academia. Why your model is 2GB when it should be 200MB.